
The businesses of branch-based planners and advisors with Canada’s Big Six banks took a heavy hit over the past year.
Top-line results from the latest edition of Investment Executive’s Report Card on Banks indicate that average assets were down significantly from the previous year, and client numbers dropped as well. However, much of this pain was confined to the top end of the industry as mainstream branch advisors’ businesses held up well in comparison.
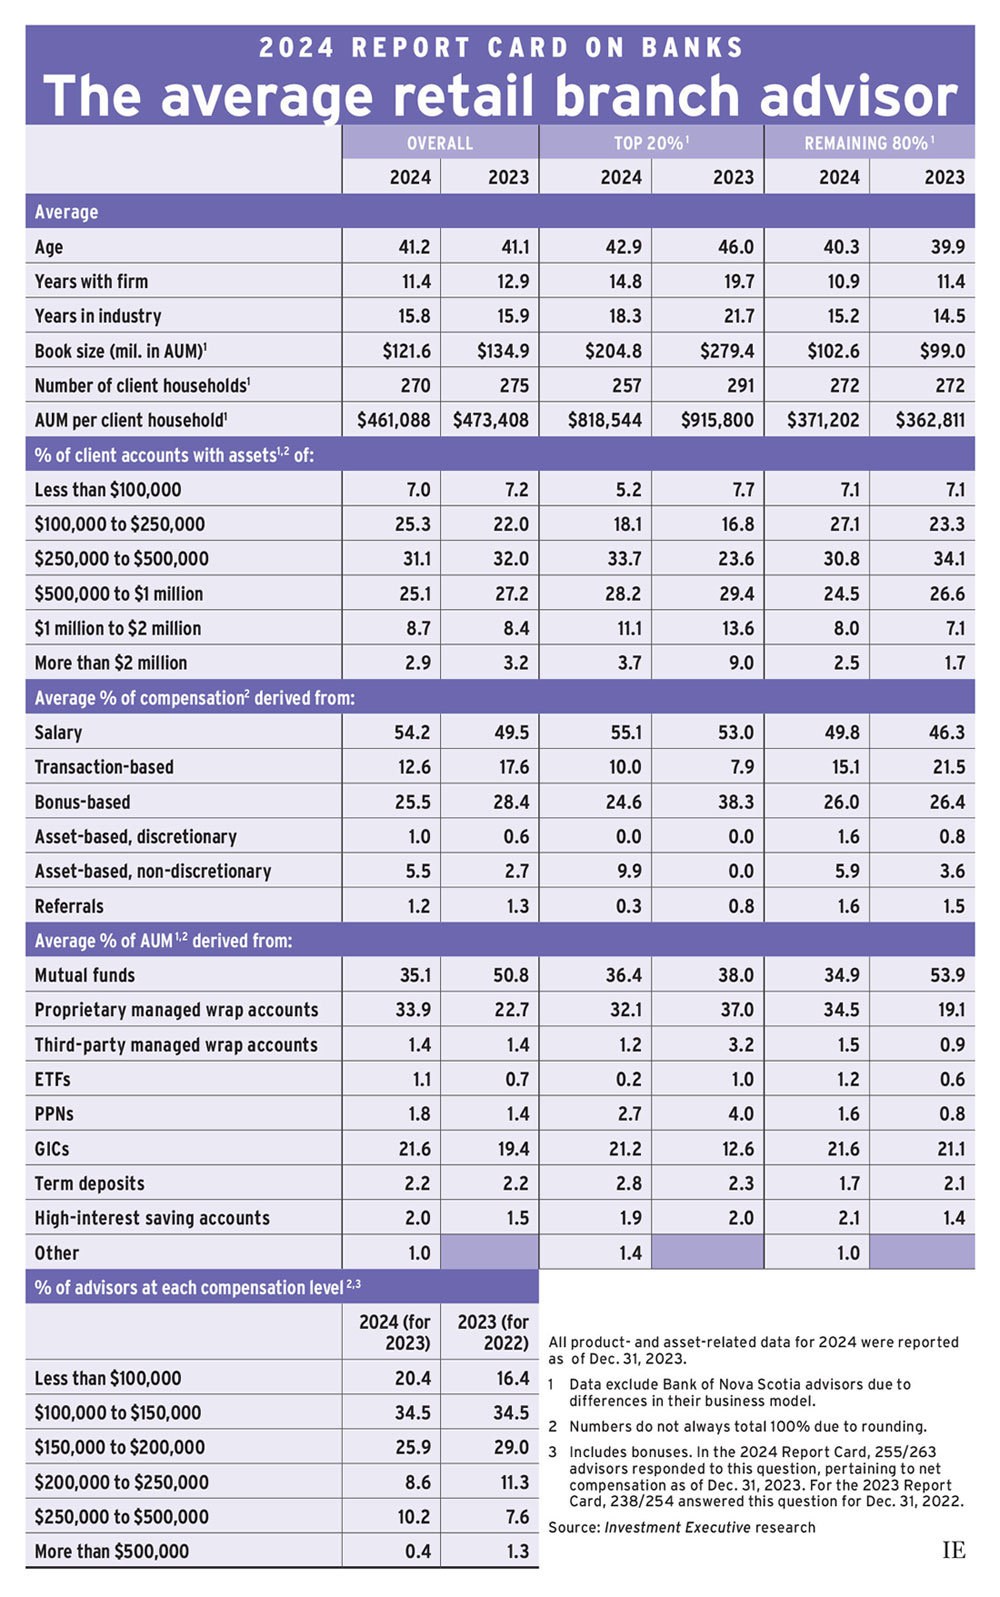
The 2024 Report Card showed an overall lack of growth for the average branch-based advisor. Assets under management (AUM; measured as of Dec. 31, 2023) for the survey sample was down about 10% year over year, to $121.6 million from $134.9 million as of Dec. 31, 2022. (As in past years, these results exclude branch advisors from Bank of Nova Scotia, which has a different business model.)
This decline in AUM came, at least in part, amid an erosion in client numbers overall. The average number of households served by planners and advisors in the 2024 Report Card fell to 270 from 275 in the 2023 research. Moreover, productivity — measured as AUM per client household — dropped slightly to $461,088 from $473,408 in last year’s report.
The decline in average AUM reflected more than just branch advisors serving fewer households: the average asset levels of their clients contracted, too. Markets weren’t to blame for this erosion in assets, as both fixed-income and equities markets performed better in 2023 than 2022. Instead, the Report Card data suggest branch-based advisors had trouble retaining higher-value clients.
The share of these advisors’ books devoted to client households worth more than $1 million was essentially unchanged year over year at 11.6% in 2024, but some accounts migrated toward the lower end of the scale. In last year’s Report Card, households worth more than $2 million represented 3.2% of advisors’ books. This year, that share was 2.9%.
There also was a drop in the share of client households in the $250,000–$1 million range. Those accounts represented 56.2% of the average book, down from 59.2% in last year’s Report Card.
One driver was a shift in the average respondent for the survey — demographics for this year’s top 20% of branch advisors (based on AUM per client household) were much different. This year’s top producers were notably younger and less experienced, and managed smaller books than the top producers assessed in 2023.
The average top producer in 2024’s Report Card was more than three years younger than their counterpart in 2023 (age 42.9 vs. 46.0). This drop in age was accompanied by a decline in experience. The average top producer in 2024 reported having worked in the industry for 18.3 years, down from 21.7 in last year’s research.
This year’s top-20% group also had smaller books than last year’s group. The average top producer reported $204.8 million in AUM, down sharply from $279.4 million in last year’s Report Card.
As with the overall population, some of this change was explained by smaller client rosters — 2024’s average top performer served 257 households, down from 291 in last year’s report — but productivity was down, too. Average AUM per client household for 2024’s top 20% dropped by almost 11% to $818,544 this year from $915,800 last year.
This fundamental shift in the population of top-producing advisors also was reflected in the client data. In last year’s Report Card, the average top performer reported that 22.6% of their book was devoted to accounts worth $1 million or more in AUM. In 2024, that segment accounted for 14.8% of the average top producer’s book. The share of accounts in the $500,000–$1 million segment, meanwhile, fell to 28.2% from 29.4% in last year’s report.
For the remaining 80% of planners and advisors in the Report Card, average AUM was up slightly year over year, to $102.6 million from $99 million in last year’s Report Card.
While client numbers were flat for these respondents, productivity improved. Average AUM per client household was $371,202, up from $362,811.
Unlike the top 20%, the other 80% of advisors didn’t see a sharp decline in their exposure to the largest client accounts. For the latter group, the allocation to accounts worth $1 million or more rose to 10.5% of the average book this year from 8.8% last year.
The effects of the industry’s evolution were also reflected in the compensation data for branch-based planners and advisors. With the retreat among the top performers, the share of top-earning branch-based advisors dropped. Notably, the proportion of advisors in this Report Card that reported earning over $500,000 per year was just 0.4%, down from 1.3% last year.
The share of advisors that reported earning between $250,000 and $500,000 annually climbed to 10.2%, from 7.6% in last year’s Report Card — encompassing a larger portion of the industry’s younger, less experienced top performers. The proportion of respondents in the lowest-paid group also rose, up to 20.4% this year from 16.4% in last year’s report.
Click image for full-size chart
This article appears in the October issue of Investment Executive. Subscribe to the print edition, read the digital edition or read the articles online.