When people in neighbouring countries have many similarities, it’s easily forgotten that they also can be quite different. Such is the case with Canadian and American consumers.
A recent study conducted by Toronto-Dominion Bank‘s economics department provides a look at the various differences between these two peoples:
– Age. The average age of Canadian consumers is 40 years old, compared with 37 for American shoppers.
– Multiculturalism. One-fifth of Canada’s residents (20.6%) are foreign-born vs just 12.9% in the U.S., according to 2011 census figures. This reflects more immigration into Canada, as well as a lower birth rate. On average, Canadian women have had 1.6 children over the past 30 years vs 1.9 for American women, so couples are not replacing themselves.
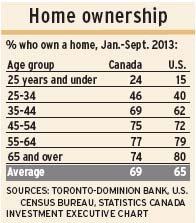
– Home ownership. Historically, Americans have had higher levels of home ownership; but Canadians now have pulled ahead, thanks to better access to credit since the global financial crisis. This is particularly so for younger Canadians, age 25 and under, 24% of whom own a house. (See accompanying table.)
– Income. Americans have more money to spend than Canadians do, with personal disposable income per capita averaging $39,950 vs $26,888 in Canada in the nine months ended Sept. 30, 2013. (All figures are in U.S. dollars).
– Spending patterns. This data, which is based on households rather than individuals, indicates that in most income groups, Canadian households spend more than American ones. That sounds contradictory, given higher U.S. incomes, but the TD report notes that Americans get “more bang for their buck” because consumer prices are lower in the U.S.
The only exception is “prime working-age” (PWA) households – defined as being headed by a person aged 35 to 54 in the U.S. and by someone aged 40 to 54 in Canada. According to the latest data available, American PWA households spent an average of $120,172 in 2012 while Canadian PWA households spent just $73,671 on average in 2011.
The differentials are much less when it comes to older households; those with heads aged 55 to 64 spent $61,597 in Canada vs $55,636 in the U.S. And households headed by someone 65 or older spent $41,863 in Canada vs $40,410 in the U.S.
The definitions of the younger groups are too different in the Canadian and U.S. surveys to make meaningful comparisons.
The two countries’ surveys aren’t strictly comparable, given both the different age groups and because of different participation dates for the surveys. However, the differential is close enough for the PWA groups that it clearly indicates much higher spending by American PWA households.
This result reflects both higher wages and salaries in the U.S. and much greater income disparity. Not only are there a greater percentages of households with little income and those headed by high-earning individuals south of the border, but these differences are particularly marked in the PWA years.
The data also show how Canadians and Americans spend their disposable incomes differently. For example, in the U.S., the PWA group spends $6,420 “eating out” while Canadian PWA households spend just $2,526. It’s interesting that there’s not a lot of difference in the “eating out” spending among age groups in Canada, but, in the U.S., the PWA group spends twice as much as “early career” (headed by those aged 25 to 34) and “pre-retirement” households (aged 55 to 64) and three times more than young adults (younger less than 25) and retiree households (aged 65 and older).
The TD report also notes that PWA American households spend six times as much on health care (primarily, on health insurance premiums), three times more on entertainment and almost twice as much on transportation than PWA Canadian households do.
– Debt. Despite concerns about rising Canadian household debt, Americans still have a relatively higher debt burden, at 141% of annual disposable income on average vs 137% in Canada.
© 2014 Investment Executive. All rights reserved.