This article appears in the April 2022 issue of Investment Executive. Subscribe to the print edition, read the digital edition or read the articles online.
Financial advisors will need to be more deliberate about choosing fixed-income products amid challenging conditions.
Bond investors are normally rewarded for holding longer maturities. But current market conditions are anything but normal.
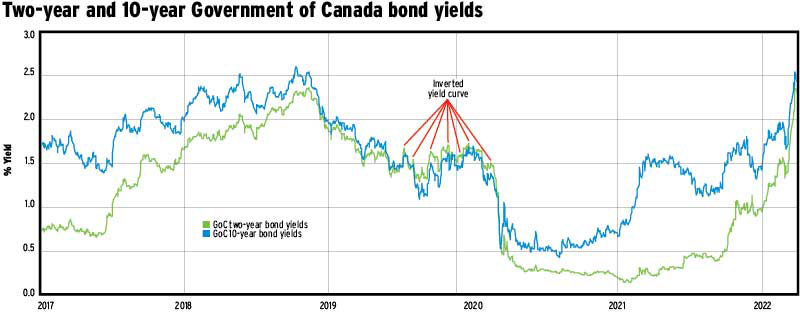
Beyond two-year terms, the yield landscape is almost as flat as a soccer pitch. Even after rising sharply this year, the yield on 10-year Government of Canada bonds was just 2.44% on April 1, only 10 basis points higher than for two-year Canadas.
The lack of yield pickup is evident when comparing passively managed funds that track fixed-income indexes. For example, the iShares Core Canadian Short Term Bond Index ETF had an average yield to maturity of 2.77% (all figures as of April 1). Farther out on the yield curve, the iShares Core Canadian Universe Term Bond Index ETF was yielding only 3.06%.
Moreover, holders of the bond-universe ETF are taking much more duration risk.
The effective duration of the iShares bond universe ETF was 7.9 years, versus only 2.7 years for the short-term ETF. Given that bond prices move in the opposite direction of interest rates, a one-percentage-point (100 basis points) increase in interest rates implies a price drop of almost 8% for the longer-maturity ETF.
In this environment of high inflation and low yields, finding one size fits all fixed-income investments is difficult, said Steven Leong, head of iShares product with Toronto-based iShares sponsor BlackRock Asset Management Canada Ltd. In deciding what to hold, investors and financial advisors need to be “more deliberate” about their objectives and which product or exposure will fit the bill.
Leong observed that advisors often place a significant portion of clients’ fixed-income assets in shorter-term ETFs. Doing so enables clients to earn higher yields than with cash instruments while “keeping the duration exposure to a fairly low number.”
Institutional investors such as pension funds may hold long-dated bonds in order to match their future liabilities, Leong said. “It’s a different dynamic from what an advisor might be normally confronting.”
For clients who primarily use fixed-income holdings to preserve capital, one alternative that yields more than short-term cash deposits is a floating-rate product. The duration risk is very low because coupons rise with market rates.
However, don’t expect much yield — at least for now. The average yield of the iShares Floating Rate Index ETF was only 1%, less than half that of a short-term bond fund.
As for inflation-protected ETFs, caution should be taken when considering funds such as the iShares Canadian Real Return Bond Index ETF and the BMO Real Return Bond Index ETF. Their durations of about 15 years, similar to those of long-term bond index funds, make them highly vulnerable to rising market rates.
Less risky real-return alternatives are ETFs that invest in U.S. Treasury Inflation-Protected Securities (TIPS) because of their shorter maturities. The durations of the BMO Short-Term US TIPS Index ETF and the iShares 0-5 Year TIPS Bond Index ETF, for example, are fairly close to that of a Canadian short-term bond ETF.
Notably, TIPS funds invest in U.S. securities, although BlackRock and BMO Investments Inc. both offer currency-hedged and unhedged versions.
A variation on the theme of keeping duration shorter than that of the broad market are bond ETFs that employ maturity ladders. The duration of the iShares 1-5 Year Laddered Government Bond Index ETF was similar to that of a conventional short-term bond ETF. A one- to 10-year ladder, although higher in duration, would still only have about half the duration of the Canadian bond universe.
Since the equal allocations to different maturities will be consistent, the duration profile of bond ladders is more predictable, Leong said. But the risk/return profile of a laddered versus a non-laddered fund that invests in similar maturities “is likely to be quite similar over time.”
Click image for full-size chart
