Despite sluggish global growth and a high degree of economic uncertainty, most stock markets around the world rose in 2012, allowing the portfolio managers of many equity and balanced funds to generate good returns. But producing above-average returns required astute stock-picking, the right mix of assets under management (AUM) – or both.
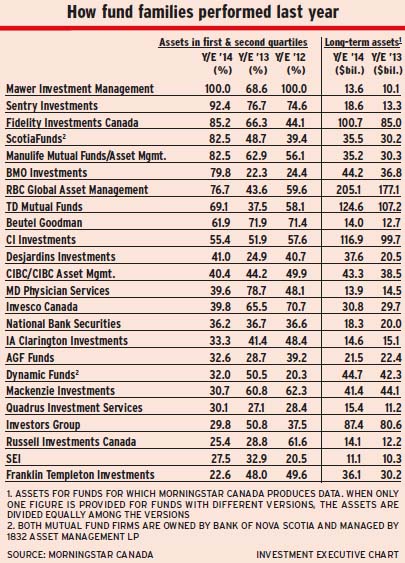
Among Canadian mutual fund families, Mawer Investment Management Ltd. of Calgary, in particular, shone on stock-picking. It led the pack in fund family performance, with all of its long-term mutual fund AUM in the first or second performance quartiles for the year ended Dec. 31, 2012, according to data from Morningstar Canada. (All companies mentioned are based in Toronto unless otherwise noted.) This is the second year in a row Mawer has been at the top of the heap.
Mawer’s approach is to find companies with “resilient business models that allow them to make money in good times, bad times and in between,” says Jamie Hyndman, director of marketing. Usually, that means these firms have a competitive advantage.
He notes that the share prices of many such companies have been bid up and profits are being taken. In turn, fund portfolio managers are investing these profits in other opportunities, such as industrial firms whose share prices have fallen.
Marc Cevey, CEO at HSBC Global Asset Management (Canada) Ltd., also credits good stock-picking for the HSBC funds’ second-place ranking, with 78.4% of long-term AUM in the top two quartiles. But, he adds, the funds’ “cyclical tilt to growth” also contributed. Portfolio managers felt that the worst was over for both the U.S. and emerging markets, and so overweighted those equities.
Another fund company with a focus on bottom-up stock-picking is Sentry Investments Inc., which took third place in the ranking, with 74.6% of its long-term AUM in the top two performance quartiles. Chief investment officer (CIO) Dennis Mitchell says Sentry’s approach is to look for companies with “quality earnings” – firms whose earnings reflect their cash-flow generation. Cash flow is used to pay salaries, dividends and to make investments.
On the other hand, BMO Investments Inc. and AGF Management Ltd. misread the economy. BMO had 24.4% of is long-term AUM in the top two quartiles in 2012, while AGF had 40.5%.
Serge Pépin, vice president, investment strategy, with BMO Global Asset Management, says the firm’s portfolio managers had thought the aftermath of the U.S. presidential election and negotiations around the “fiscal cliff” would hamper growth and markets. As a result, BMO funds were invested too defensively and missed the yearend momentum.
At AGF, focus on downside risks rather than upside potential meant that the funds weren’t invested aggressively enough, says CIO Martin Hubbes. He adds that the performance of small-cap stocks, particularly in the Acuity funds lineup, hurt performance.
@page_break@ Here’s a look at how some of the other firms’ funds performed:
– Franklin Templeton Investments Corp. (49.6% of AUM in the top two quartiles). Franklin’s Bissett and Templeton fund lineups performed well, but weak results in the Quotential funds pulled down to overall fund family performance. The Bissett funds benefited from stock-picking of quality firms with the potential for profitability over the full business cycle. At the same time, the Templeton funds were overweighted in pharmaceuticals and information technology, and their financial services holdings also did well. With a “value” investment style, these funds contained winners in most regions, including Europe and Japan, although the biggest contribution came from U.S. media and retail holdings.
– Invesco Canada Ltd. (70.7%).
The value investing style of the Trimark funds did well last year. The focus is on quality companies with strong growth prospects and whose valuations are cheap.
“A lot of investments made a number of years ago paid off in 2011 and 2012,” says Jamie Kingston, senior vice president for product management and development. He partly credits the reduction in the risk of a financial crisis in Europe, which has increased interest in the high-quality growth firms that the funds favour.
– Investors Group Inc. (37.5%). These relatively weak numbers reflect the lack of fund comparability, says Scott Penman, executive vice president and CIO of the Winnipeg-based company.
Investors Group funds are designed to fit into portfolios constructed solely of company products and thus tend to be quite “pure.” For example, the firm’s Canadian equity funds tend to have less than 20% of AUM in foreign content, while the maximum allowed for funds in this fund category is 49%. So, in a year in which the S&P/TSX composite index’s return was less than half of that of the S&P 500 composite index’s, Investors Group funds are likely to underperform. Penman adds that one of the firm’s largest funds, Investors Group Real Property Fund, is not ranked because it’s the only property fund in Canada.
– RBC Global Asset Management Inc. (59.6%). Much of the magic behind RBC’s performance is due to good decisions on asset mix and securities selection, says CIO Dan Chournous. RBC portfolio managers believed that there had been sufficient healing in the U.S. as 2012 unfolded to produce more consistent growth in that economy than in 2011. At the same time, the contribution of stock-picking was enhanced by increased investment in the quantitative and technical platform acquired when RBC purchased Vancouver-based Phillip Hager & North Investment Management Ltd. in 2008.
– TD Asset Management Inc. (58.1%). Overweighting defensive sectors such as financials, telecommunications and pipelines and underweighting energy and materials pushed up returns in TD’s dividend funds. And overweighting corporate bonds, including high-yield bonds, says Bruce Cooper, vice chairman of TDAM, enhanced the TD funds’ fixed-income returns.
© 2013 Investment Executive. All rights reserved.