This article appears in the May 2022 issue of Investment Executive. Subscribe to the print edition, read the digital edition or read the articles online.
Evermore Capital Inc. entered the ETF industry as an innovator, but you won’t find any thematics or other exotic mandates in its lineup. Instead, the Toronto-based startup launched Canada’s first suite of target-date ETFs on Feb. 23 on the NEO Exchange.
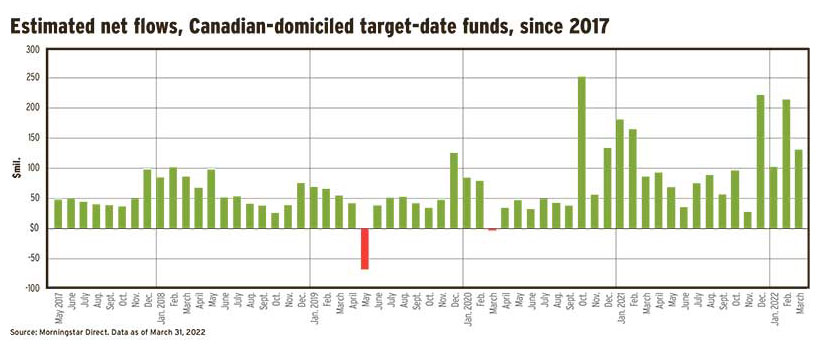
The target-date concept — asset-allocation portfolios that gradually become more conservative as they approach their maturity dates — isn’t new. More than $15 billion in target-date assets under management (AUM) are held in retail mutual funds. Target-date formats also are available through various group RRSPs and pension plans, and several families of segregated funds.
In this crowded field, Evermore’s strategy is to differentiate itself as a low-cost retail provider. “ETFs offer a cheaper wrapper for things like a target-date fund,” said Myron Genyk, Evermore’s CEO.
The management fee for all eight Evermore Retirement ETFs, with maturity dates ranging in five-year increments from 2025 to 2060, is 0.35%. Genyk estimates that expenses will add another 10 basis points, bringing the management expense ratios (MERs) to 0.45%.
This does not include the MERs of the underlying third-party ETFs that the Evermore portfolios hold. Factoring in those fees brings the total ownership cost to about 0.55%. This still leaves Evermore cheaper than target-date mutual funds, whose MERs range from 0.71% to 2.55%, according to data from Chicago-based Morningstar Inc.
Evermore currently relies on one BMO and three iShares equities ETFs, and a trio of Vanguard fixed-income ETFs. All are low-cost index funds covering broad markets: Canadian, U.S., international developed and emerging markets equities, and Canadian, U.S. and international investment-grade bonds. Nothing trendy or gimmicky here.
Evermore enters a retail space where a couple of providers have attracted billions of dollars in AUM, led by Fidelity Investments Canada ULC. The $9-billion Fidelity ClearPath suite holds a commanding market share of about 60%. Most of the remainder, about $5.3 billion, is managed by RBC Global Asset Management Inc., primarily in its three RBC Target Education funds marketed for use in RESPs.
A distant third in market share is BMO Investments Inc.,
which has $333 million in AUM in its BMO Target Education funds. But BMO has capped its $412-million BMO LifeStage Plus suite. Their locked-in gains feature resulted in the funds moving in March 2020 to “protected” portfolios consisting entirely of fixed income.
A similar fate befell the iA Clarington Target Click suite, a target-date pioneer launched in 2005, which also has maturity-guarantee provisions. AUM has shrunk to $43 million in the two remaining funds, which are closed to new investors.
Elsewhere, Invesco Canada Ltd.’s Intactive funds have struggled to attract AUM, holding a modest $40 million after having been offered since 2008. At two other former sponsors, NEI Investments and Scotia Securities Inc., target-date funds have come and gone, eliminated via mergers.
Genyk points to the strong demand for asset-allocation ETFs over the past several years as cause for optimism for his firm, which he co-founded with chief marketing officer Greg White earlier this year.
Evermore’s marketing focuses on direct investors, but “we will most likely be pursuing the wealth [advisor] channel as well in the near future,” Genyk said.
Evermore’s online educational content is aimed mostly at newbie investors. “There’s still a lot of content that is to come,” Genyk said. “We’ve got more FAQs, more blogs, more videos that are currently in production.”
The need for education to expand direct-investor sales is illustrated by research from Toronto-based Pollara Strategic Insights, which Evermore commissioned. The Pollara opinion survey found that only about half of self-directed investors said they are knowledgeable about ETFs. Also, 42% of self-directed investors who aren’t investing in ETFs said it’s because they don’t know enough about them.
Click image for full-size chart
