Advisors with Canada’s full-service and mutual fund dealers are growing their practices, but that growth hasn’t come easily.
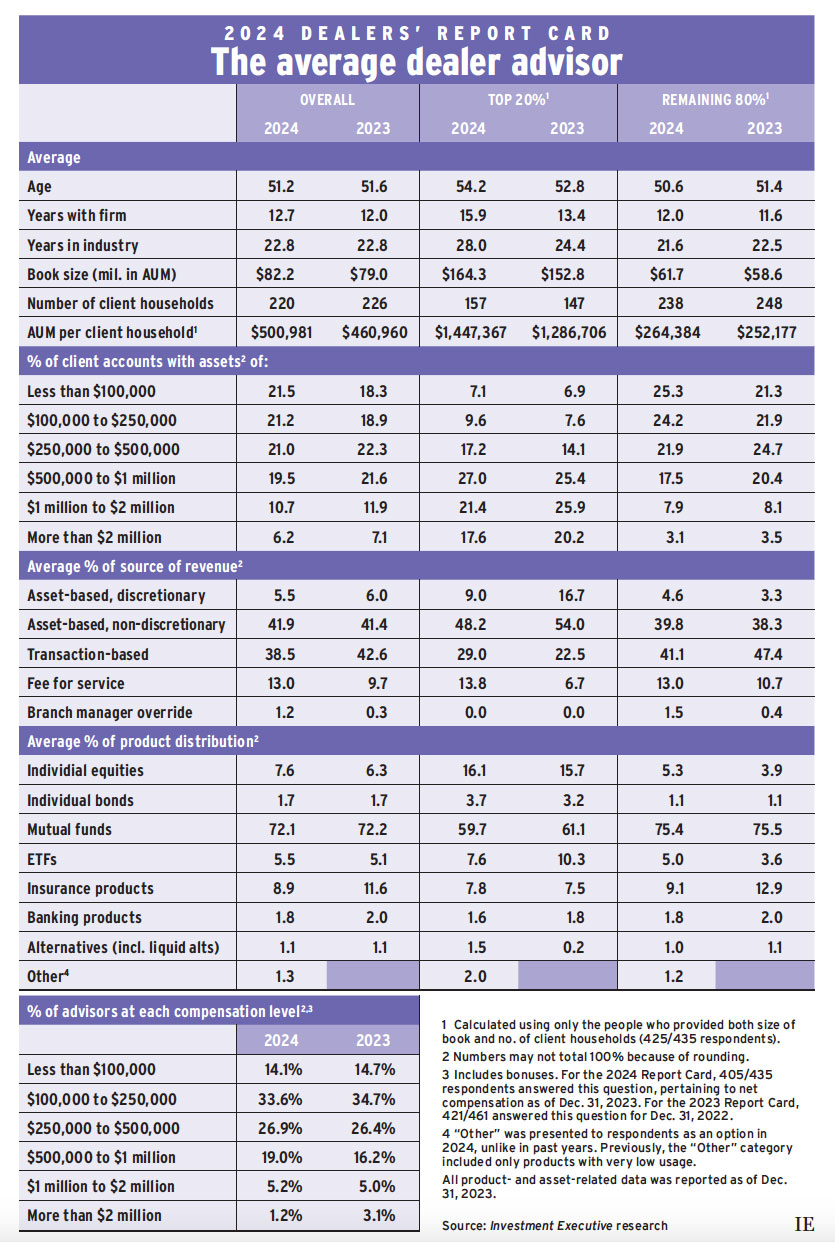
Average assets under management (AUM) for the dealer advisors in the 2024 Dealers’ Report Card came in at $82.2 million as of Dec. 31, 2023, up from $79.0 million in last year’s research.
This growth came against a backdrop of shifting competitive dynamics in the retail investment business.
One of the biggest changes was the consolidation of the Investment Industry Regulatory Organization of Canada and the Mutual Fund Dealers Association of Canada in 2023. The launch of the Canadian Investment Regulatory Organization (CIRO) has opened the field to dual-registered dealers, putting added pressure on traditional fund dealer firms. As of press time, CIRO has approved eight dual-registered dealers.
At the same time, investors are gravitating toward online platforms, a growing competitive threat for advisors seeking to serve new investors and middle-market clients.
Against this backdrop, the number of client households served by the average advisor, as of Dec. 31, 2023, was down slightly year over year — dropping to 220 from 226. The combination of modest asset growth and marginally smaller client bases boosted average AUM per client, however, which crept above the $500,000 mark compared with $460,960 in last year’s research.
The industry’s top-producing advisors continued to outperform the rest of the industry in terms of asset growth.
Among top performers — defined as the top 20% of the advisor population based on AUM per client household — average AUM rose to $164.3 million in this year’s Report Card from $152.8 million last year.
Average AUM for the other 80% of advisors also rose year over year, but more modestly, to $61.7 million from $58.6 million.
The top performers’ stronger asset growth was likely fuelled, at least partly, by higher client-household numbers. The average top-producing advisor added 10 client households year over year, while the average advisor representing the rest of the industry lost 10 households.
Average AUM per household for top performers jumped to $1.45 million in the 2024 research from $1.29 million the year prior. However, a few outliers this year reported AUM per household that was far higher than their peers. Excluding these outliers, average AUM per household actually dropped to $1.12 million.
This shift could be attributed to top-performing advisors having reduced their allocations to accounts worth more than $1 million. In the 2023 Report Card, the average top performer had 46.1% of their book devoted to accounts worth more than $1 million. In 2024, that portion was down to 39.0%.
Among the remaining 80% of advisors, allocations to accounts worth more than $1 million hardly changed year over year, but accounts worth up to $250,000 captured a larger share of the average book. Specifically, allocations to those accounts rose to 49.5% in this year’s research from 43.2% in 2023, while the share of accounts in the $250,000–$1 million range dropped to 39.4% from 45.1%.
Taken together, those figures suggest increased competition for clients is taking place primarily in the middle to high end of advisors’ books.
Compensation data (reported as of Dec. 31, 2023) reflected competitive stresses, too. The share of advisors who reported earning more than $2 million per year dropped sharply to 1.2% in this year’s Report Card from 3.1% last year. However, the percentage of advisors who reported earning up to $250,000 per year also dropped, albeit less dramatically, to 47.7% from 49.4%.
Meanwhile, the percentage of advisors earning $500,000–$1 million rose to 19.0% in this year’s research from 16.2% last year.
Click image for full-size chart
This article appears in the September issue of Investment Executive. Subscribe to the print edition, read the digital edition or read the articles online.
