“Coach’s Forum” is a place to ask your questions, tell your stories or give your opinions on any aspect of practice management. Our objective is to build a community with a common interest in making financial advisory practices as effective as possible.
ADVISOR SAYS: I recently made changes to my support staff while following the advice in your recent column on creating a diversified team.
We made those changes while accounting for a modest increase to my practice over the next three to five years. However, the question arises: How big do I want to become? It’s easy to just say “bigger” or “I want a 10% increase per year,” but I also need to ensure our team can adequately serve our clients as we grow. Any recommendations?
COACH SAYS: First, congrats on the team evaluation and realignment, as well as thinking beyond organizational design to your strategy for growth. Given the margin squeeze on advisors’ practices and competition for talent today, “right-sizing” your practice and understanding your capacity are essential for long-term success.
Regarding your question, my firm has developed a “capacity calculator” along with a four-step plan for our coaching clients. Here’s how it works:
STEP 1: Segment by revenue.
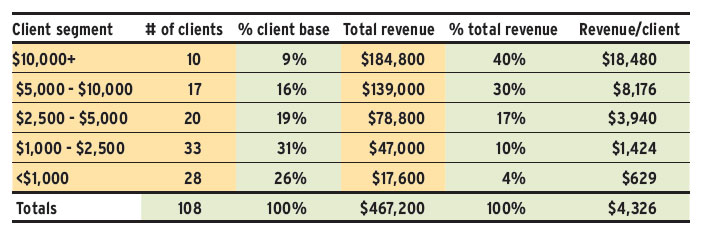
Divide your client base into segments based on average annual revenue. If you haven’t created those segments yet, create a spreadsheet listing all your clients and their associated annual revenue. Sort by revenue, from highest to lowest. You will probably see potential “breaks” in the revenue that you can use as segmentation for this purpose. Here’s a sample from the calculator. (You would fill in the yellow cells; the green cells fill automatically.)
Click image for full-size chart
Note the additional value you get from this exercise. For example, knowing that your top 10 out of 108 clients (9%) generate 40% of your revenue and that your top 27 clients (25%) generate 70% of your revenue has implications for issues such as service levels and marketing activities.
STEP 2: Estimate a year’s work.
Calculate the approximate number of hours you work in an average year. For example, if you average 45 hours per week for 45 weeks of the year, your total annual capacity is 2,025 hours.
STEP 3: Estimate relationship management time.
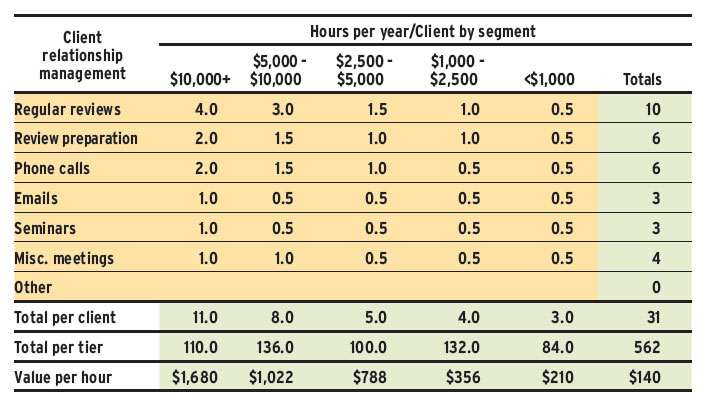
Calculate the number of hours per year you spend on activities that could be described as client relationship management for each segment. Here’s an example from the calculator:
Click image for full-size chart
In this example, the advisor spends a total of 562 hours per year managing client relationships. That may seem like a lot, but given a 45-week capacity, it represents less than 2.5 hours a day to carry out all the relationship-management activities. Does that reflect reality?
Even if it does, is that time being spent wisely? This advisor spends 11 hours per year managing relationships with each of their top-tier clients, for an average compensation of $1,680 per hour. They spend three hours per year with their bottom-tier clients, who generate only $210 an hour. While all clients deserve service and attention, reallocating some hours spent on low-value activities to more rewarding ones may make sense.
STEP 4: Assess other activities.
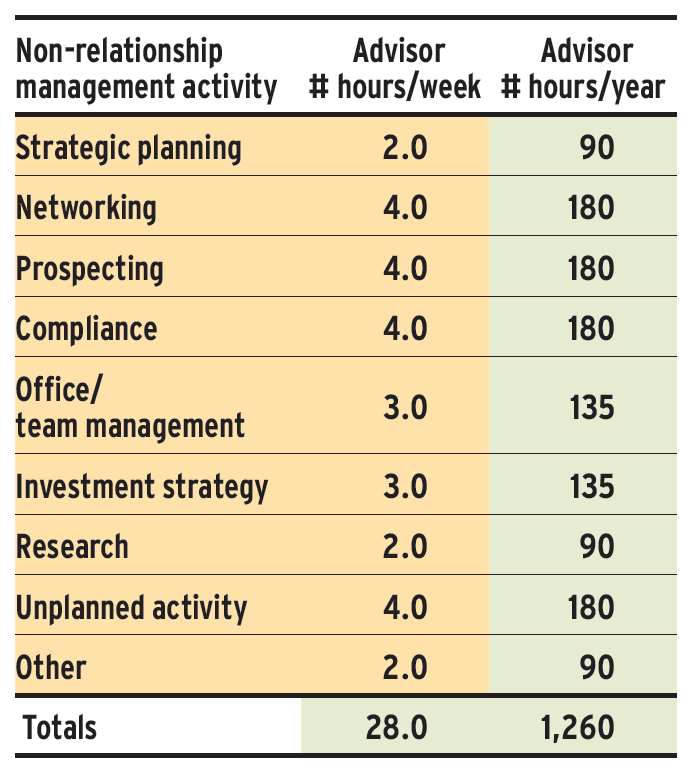
Estimate the number of hours per year you spend on activities that could be described as “non-relationship-management.” An example from the calculator appears below.
Note these activities are not segmented because they are attributed across all clients. In this example, the advisor spends 1,260 hours per year in non-relationship-management activity. Once more, we can use this information to optimize the advisor’s time management. If I were in a coaching relationship with this advisor, I would ask: “Are you actually setting aside a full eight-hour day every month (two hours a week) to work on your strategic plan? Does compliance really only take up less than one hour per day? How effective are you in managing your team and the business overall with just over a half-hour per day allocated to that task?”
So, how do we manage capacity? As noted, the advisor in our example has a “personal capacity” of 2,025 hours. They spend 562 of those hours in client relationship activities and 1,260 hours in non-relationship activities (see table below), for a total of 1,822 hours. That leaves “excess capacity,” so to speak, of 203 hours. So, what’s the problem? Don’t we have excess capacity? On paper, yes; in reality, probably not.
Click image for full-size chart
Given a 45-week availability, 203 hours is less than one hour per day. Two things can eat up that time quickly:
A. Advisors frequently underestimate time spent on miscellaneous activities. Also, we haven’t accounted for unexpected client requests, technology breakdowns, company meetings and other disruptions.
B. As practices grow, they inevitably become more complex and bureaucratic. As a result, advisors often have to spend more time managing their business than practising their craft as advisors.
To account for these inevitabilities, you should always build a buffer into your capacity.
The situation in this example works for the advisor, as long as they don’t want to grow their business. If they do, however, they need a better approach to managing their capacity.
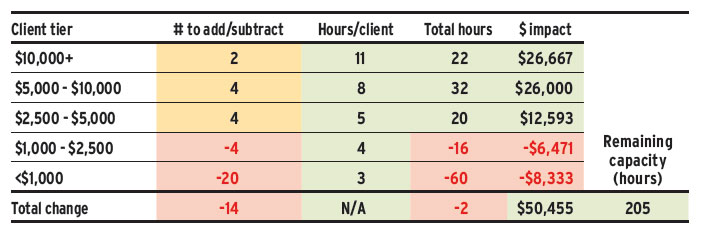
This is the fun part. The final step is to use the calculator to test various scenarios by varying the number of clients in each segment to determine the impact. Here’s an example:
Click image for full-size chart
In this case, the advisor estimated that with the proper focus and business development activities, they could add 10 clients each year — specifically, two at $10,000 or more in revenue; four at $5,000–$10,000; and four at $2,500–$5,000. Adding those new clients would simultaneously reduce the advisor’s capacity by 74 hours ([2 x 11 hours] + [4 x 8 hours] + [4 x 5 hours]).
So, where do we find 74 hours of capacity? There are various options, including reducing service commitments. This advisor decided instead to “graduate” most of their lowest-tier clients (20) and a few of their second-lowest tier (four) to another advisor. (There are always relationships in any tier that you want to keep no matter what.)
By doing so, this advisor got back 76 hours, leaving approximately the same amount of buffer time: 205 hours. Oh, and their projected earnings went up by $50,000!
Here’s another bonus: in most practices, much of the relationship management and service work for lower-tier clients falls to support staff, so transferring several of those clients to another advisor very likely creates additional staff capacity.
The calculator is not predictive and is designed only to stimulate your thinking about one way to right-size your business while managing capacity and increasing revenue and efficiency.
If you find this calculator helpful, I am happy to provide it for your personal use at no cost and no obligation. Just email academy@ultimate-practice.com with the word “calculator” in the subject line. We will also include our companion Client Profitability Calculator to help you determine whether you are being adequately rewarded for the services you provide.
George Hartman is CEO of Market Logics Inc. in Toronto. Send questions and comments regarding this column to george@marketlogics.ca.
This article appears in the February issue of Investment Executive. Subscribe to the print edition, read the digital edition or read the articles online.


