
Heightened economic uncertainty and growing financial stress plagued many households last year. Nonetheless, the average brokerage advisor earned more money and operated more productively.
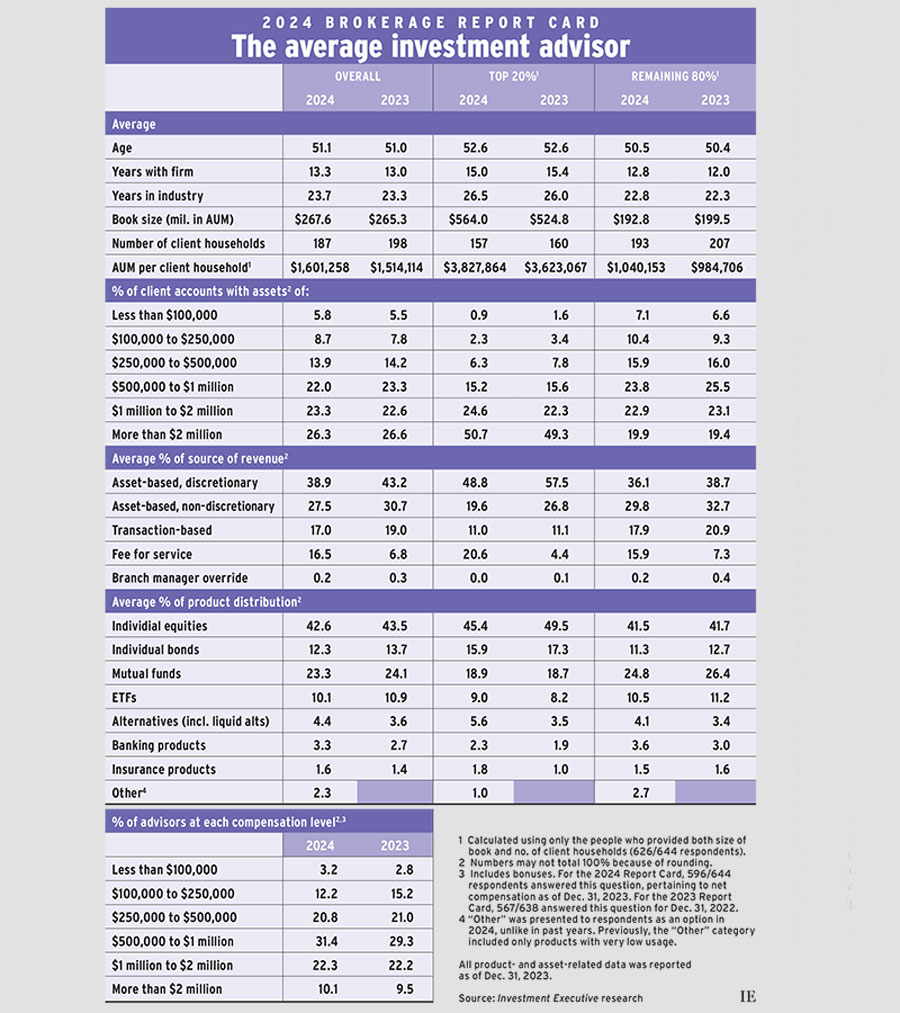
In this year’s Investment Executive Brokerage Report Card, the average advisor’s assets under management (AUM; as of Dec. 31, 2023) edged up 0.8% to $267.6 million. This modest increase came against a backdrop of intensifying financial pressures, fears of a recession and relatively weak Canadian equities markets.
For example, the S&P/TSX composite index closed 2023 up by almost 8% for the year, lagging both the S&P 500, which gained 24%, and the Nasdaq, up 43%, over the same period.
Statistics Canada also found that household net wealth increased by 7.0% during 2023. That growth was driven by gains in financial assets, which offset weaker real estate values.
Against these conditions, the average advisor in this year’s Report Card saw a modest increase in average AUM, with the average advisor’s AUM per client household growing more impressively.
The average client roster in this year’s research dropped to 187 households, down from 198 households last year. As a result, the average AUM per client household rose by almost 6% to slightly more than $1.6 million in this year’s research, up from just over $1.5 million the year before.
The path to this greater productivity differed for top-performing advisors versus their remaining peers. Among top performers — defined as the top 20% of the advisor population in terms of AUM per household — average AUM rose, while household numbers dipped only slightly. For the rest of the industry, average AUM dropped slightly year over year, but client numbers dropped more sharply.
For the top 20% of advisors, average AUM climbed 7.5% to $564 million in this year’s Report Card, from $524.8 million last year. Meanwhile, average client numbers for this segment of the advisor population dropped to 157 households in 2024’s research, from 160 households in 2023’s. This combination of higher average AUM and slightly lower household numbers resulted in average AUM per household rising by 5.7%.
As for the other 80% of advisors, average AUM per household exceeded $1 million in this year’s research, up from $984,706 last year. The million-dollar threshold was surpassed despite a decline in average AUM.
Average AUM for the lower segment of advisors dropped to $192.8 million from $199.5 million last year. Client numbers fell about twice as rapidly, to 193 households in this year’s research from 207 households the year before.
The stronger rise in AUM per client household among the top 20% of advisors came alongside growth in their wealthiest accounts. The average top performer reported 75.3% of their book was devoted to accounts worth more than $1 million, up from 71.6% last year. Additionally, more than half (50.7%) of their accounts were worth more than $2 million, up from 49.3% last year.
For the other 80% of advisors, allocation to accounts worth over $1 million was up slightly, to 42.8% of the average book, from 42.5% in 2023. These advisors also saw their exposure to the smallest accounts increase: the share of the average book devoted to accounts worth less than $250,000 rose to 17.5% in this year’s research from 15.9% last year.
The asset mix reported in the Report Card evolved alongside these shifts in account distribution.
Allocations to bonds, equities, mutual funds and ETFs declined, while exposure to alternative investments and banking products rose.
Among the top 20% of advisors, direct equities exposure was down sharply year over year. In last year’s Report Card, the top-performing advisors had almost half (49.5%) of their clients’ portfolios in individual stocks. This year, that proportion dropped to 45.4%. Top performers’ bond exposure was down too, declining to 15.9% from 17.3% last year.
These advisors instead increased exposure to alternative investments. This year, top-performing advisors reported that 5.6% of their clients’ portfolios were devoted to alternatives, up from 3.5% a year ago. Allocations to mutual funds were essentially unchanged while ETF exposure climbed to 9.0% from 8.2%.
Allocations to banking and insurance products rose, too, as clients benefited from higher interest rates.
Among the remaining 80% of advisors, equities allocations remained virtually unchanged year over year. Mutual fund exposure declined slightly, to 24.8% of the average book, from 26.4% last year. Individual bond allocations also were trimmed, as was ETF exposure.
These advisors also increased their exposure to alternative investments, but not by as much as the top performers. The allocations to alternatives for this group rose to 4.1% from 3.4% last year, and they also bumped up their banking product allocations amid higher interest rates.
The advisor compensation picture skewed to the upside as well.
The proportion of advisors who reported earning more than $2 million per year rose to 10.1%, up from 9.5% in last year’s research. And the share of advisors who reported earning between $500,000 and $1 million climbed to 31.4% this year from 29.3% in 2023.
Conversely, the share of advisors who earned less than $250,000 annually dropped to 15.4% this year from 18.0% last year. The middle-income categories were generally stable year over year.
Click image for full-size chart
This article appears in the June issue of Investment Executive. Subscribe to the print edition, read the digital edition or read the articles online.